Spring 2006
Nonlinear Map Demonstration Using Scilab
The Scilab program that I used to demonstrate the iterations of a nonlinear
map is here: iterate_example.sci.
Save this file somewhere convenient, and run Scilab in the same directory
as where the file is saved.
Then give the Scilab command
-->exec("iterate_example.sci")
This will define the function
iterate_example(ics,N,b,bounds), where the arguments are
- ics: An n x 2 array of initial conditions.
- N: The number of iterations to compute for each initial condition.
- b: The parameter in the nonlinear map.
- bounds: An array of the form [xmin ymin; xmax ymax]. The iteration
of a solution will stop if a point goes outside of these bounds. These are also
used as the data bounds of the plot window. (The bounds of the plot window are set
at the end, so the first time you use the function, the bounds will change
dynamically as more points are plotted.)
The map is
| x(n+1) | = | (1-x(n))x(n) + b y(n) |
| y(n+1) | = | y(n)/2 + x(n) |
Example.
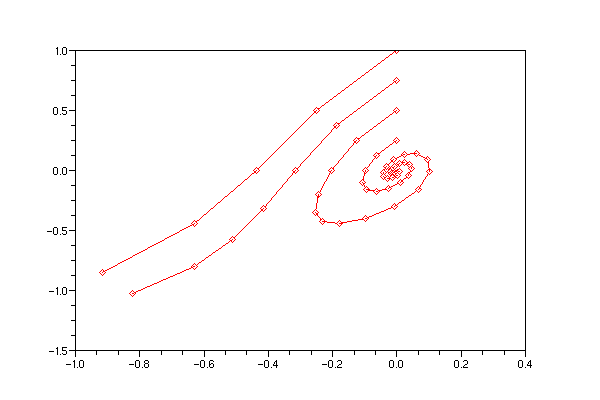
The following command will plot the first 20 iterations for the initial conditions
(0,1/4), (0,1/2), (0,3/4) and (0,1), using b=-1/4, and restricting the data display
to -1 < x < 0.4 and -1.2 < y < 1.
-->iterate_example([0 0.25; 0 0.5; 0 0.75; 0 1],20,-0.25,[-1 -1.2; 0.4 1])
You should see a plot like this:
If you call the function again, it will add the new plots to the existing plot.
To clear the current plot, use the clf command:
-->clf