Homework Problems due 1/29:
1. For each pair of variables, specify which variable is
the explanatory variable and which is the response
variable in the relationship between them.
a. Amount person walks or runs per day and performance on a test of lung function.
b. Feeling about importance of religion and age of respondent.
c. Score on the final exam and the final course grade in a psychology course.
d. Opinion about the death penalty (favor or oppose), and gender (male or female).
2. For each of the examples given here, decide whether
the study was an observational study or a randomized
experiment.
a. A group of 100 students was randomly divided, with
50 assigned to receive vitamin C and the remaining
50 to receive a placebo, to determine whether vitamin
C helps to prevent colds.
b. All patients who received a hip transplant operation
at Stanford University Hospital during 1995 to
2005 will be followed for 10 years after their operation
to determine the success (or failure) of the
transplant.
c. A group of students who were enrolled in an introductory
statistics course were randomly assigned
to take a Web-based course or to take a traditional
lecture course. The two methods were compared
by giving the same final examination in both
courses.
d. A group of smokers and a group of nonsmokers who
visited a particular clinic were asked to come in for a
physical exam every 5 years for the rest of their lives
to monitor and compare their health status.
3. Suppose that an observational study showed that
students who get at least 7 hours of sleep performed
better on exams than students who didn't. Which of
the following are possible confounding variables, and
which are not? Explain why in each case.
a. Number of courses the student took that term.
b. Weight of the student.
c. Number of hours the student spent partying in a
typical week.
4. An article in the magazine Science (Service, 1994) discussed
a study comparing the health of 6000 vegetarians
and a similar number of their friends and relatives
who were not vegetarians. The vegetarians had a 28%
lower death rate from heart attacks and a 39% lower
death rate from cancer, even after the researchers accounted
for differences in smoking, weight, and social
class. In other words, the reported percentages
were the remaining differences after adjusting for differences
in death rates due to those factors.
a. Is this an observational study or a randomized experiment?
Explain.
b. On the basis of this information, can we conclude
that a vegetarian diet causes lower death rates from
heart attacks and cancer? Explain.
c. Give an example of a potential confounding variable
and explain what it means to say that this is a
confounding variable.
5. Which type of bias do you think would be introduced in each of the following situations?
a. A list of registered automobile owners is used to select a random sample for a survey about whether people think homeowners should pay a surtax to support public parks.
b. A survey is mailed to a random sample of residents in a city asking whether they think the current mayor is doing an acceptable job.
c. A student stands outsude the university library asking people who are leaving if they would like the see the closing hours of the library push back to a later time.
d. A magazine sends a survey to a random sample of its subscribers asking them whether they would like the frequency of publication reduced from biweekly to monthly or would prefer that it remain the same.
e. A random sample of registered voters is contacted by phone and asked whether or not they are going to vote in the upcoming presidential election.
6. In each of the following situations, indicate whether
the potential bias is a selection bias, a nonresponse
bias, a response bias, or a convenience or haphazard sample.
a. A survey question asked of unmarried men was
"What is the most important feature you consider
when deciding whether to date somebody?" The
results were found to depend on whether the interviewer
was male or female.
b. In a study of women's opinions about community issues,
investigators randomly selected a sample of
households and interviewed a woman from each selected
household. When no woman was present in a
selected household, a next-door neighbor was interviewed
instead. The survey was done during daytime
hours, so working women might have been disproportionately
missed.
c. A telephone survey of 500 residences is conducted.
People refused to talk to the interviewer in 200 of
the residences.
d. A student sets up a booth and randomly asks people to sign a petition that would ban the use of the chemical "dihydrogen monoxide."
The people are told a lengthy explanation of the dangers of this chemical and its uses, ranging from nuclear power plants to the distribution of pesticides.
It can even be found in tumors. Afterwards, the people can decide if they want to sign the petition.
(In the end, most everybody signed the petition, and only one person realized that dihydrogen monoxide is water.)
7. A (hypothetical) study is carried out to determine the effect of party affiliation on voting behavior in a certain city.
The city is divided up into wards. In each ward, the percentage of registered Democrats who vote is higher than the percentage of registered Republicans who vote.
True or false: for the city as a whole, the percentage of registered Democrats who vote must be higher than the percentage of registered Republicans who vote.
If true, why? If false, give an example.
8. Suppose two hospitals are willing to participate in an
experiment to test a new treatment, and both hospitals
agree to include 1100 patients in the study. Because
the researchers who are conducting the experiment
are on the staff of hospital A, they decide to perform
the majority of cases with the new procedure. They
randomly assign 1000 patients to the new treatment,
with the remaining 100 receiving the standard treatment.
Hospital B, which is a bit reluctant to try something
new on too many patients, agrees to randomly
assign 100 patients to the new treatment, leaving 1000
to receive the standard treatment. The following table
displays the results:
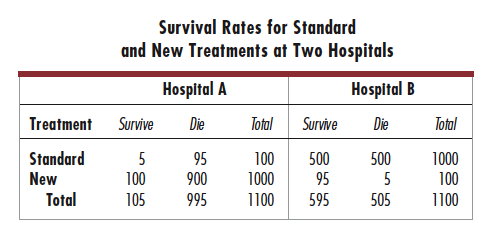
a. Which treatment was more successful in hospital A? Justify your answer with relevant percents.
b. Which treatment was more successful in hospital B? Justify your answer with relevant percents.
c. Combine the data from the two hospitals to find the overall percentages. Which treatment has the higher survival rate in overall percentages?
d. Explain how this exercise is an example of Simpson's paradox.
9. For each of the following variables, indicate whether the variable is categorical or quantitative.
a. Importance of religion to respondent (very, somewhat, or not very important).
b. Hours of sleep last night.
c. Weights of adult women, measured in pounds.
d. Favorite color for an automobile.
10. The figure below is a histogram showing the distribution of blood pressure for all 14,148 in a recent Drug Study. Use the histogram to answer the following questions:
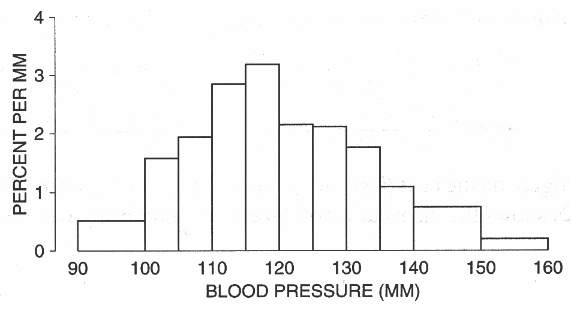
a. Is the percentage of women with blood pressures above 130 mm around 25%, 50% or 99%?
b. Is the percentage of women with blood pressures between 90 mm and 160 mm around 25%, 50% or 99%?
c. In which interval are there more women: 135-140 mm or 140-150 mm?
d. Which interval is more crowded: 135-140 mm or 140-150 mm?
e. On the interval 125-130 mm, the height of the histogram is about 2.1% per mm. What percentage of the women had blood pressures in this class interval?
f. Which interval has more women: 97-98 mm or 102-103 mm?
g. Which is the most crowded millimeter of all?
11. In one hypothetical study, 100 people had their heights measured to the nearest eighth of an inch.
A histogram for the results is shown below.
Two of the following lists have this histogram.
Which ones, and why?
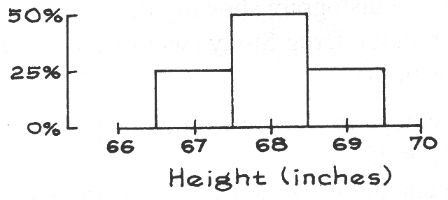
(i) 25 people, 67 inches tall; 50 people, 68 inches tall; 25 people, 69 inches tall.
(ii) 10 people, 66¾ inches tall; 15 people, 67¼ inches tall; 50 people, 68 inches tall; 25 people, 69 inches tall.
(iii) 30 people, 67 inches tall; 40 people, 68 inches tall; 30 people, 69 inches tall.
12. The age distribution of people in the U.S. in 2004 is shown below. Draw the histogram.
(The class intervals include the left endpoint, not the right; for instance, on the second line of the table, 14% of the people were age 5 years or more but had not yet turned 15.
The interval for "75 or over" can be ended at 85. Men and women are combined in the data.) Use your histogram to answer the following questions.
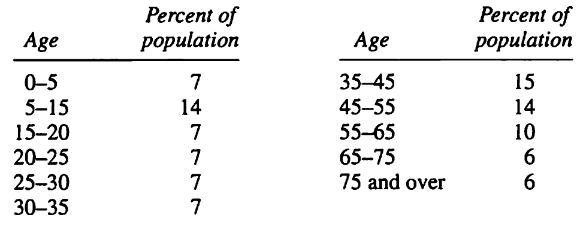
a. Which of the following is more likely: more children age 1 or elders age 71?
b. Which of the following is more likely: more 21-year-olds or 61-year-olds?
c. Which of the following is more likely: more people age 0-4 or 65-69?
d. The percentage of people age 35 and over is around 25%, 50% or 75%?
13.
a. Both of the following lists have the same average of 50. Which one has the smaller SD, and why? No computations are necessary.
i. 50, 40, 60, 30, 70, 25, 75
ii. 50, 40, 60, 30, 70, 25, 75, 50, 50, 50
b. Repeat, for the following two lists.
i. 50, 40, 60, 30, 70, 25, 75
ii. 50, 40, 60, 30, 70, 25, 75, 99, 1
14. Consider the following data values: 110, 123, 132, 150, 127, 118, 102, 122.
a. Find the value of the average for the data. (Show your work.)
b. Find the value of the standard deviation, SD, for the data. (Show your work.)
15. Below are sketches of histograms for three lists.
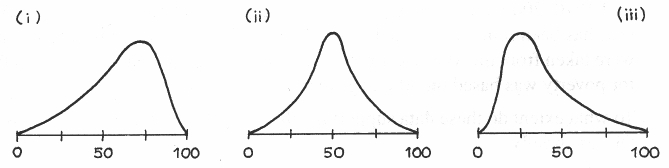
a. In scrambled order, the averages are 40, 50, 60. Match the histograms with the averages.
b. Match the histogram with the description:
the median is less than the average
the median is about equal to the average
the median is bigger than the average
c. Is the SD of histogram (iii) around 5, 15 or 50?
d. True or false, and explain: the SD for histogram (i) is a lot smaller than that for histogram (iii).
16. Incoming students at a certain law school have an average LSAT (Law School Aptitude
Test) score of 163 and an SD of 8. Tomorrow, one of these students will be picked at
random. You have to guess the score now; the guess will be compared with the actual
score, to see how far off it is. Each point off will cost a dollar. (For example, if the
guess is 158 and the score is really 151, you will have to pay $7.)
a. Is the best guess 150, 163, or 170?
b.You have about 1 chance in 3 to lose more than ______. Fill in the blank. Options: $1, $8, $20.
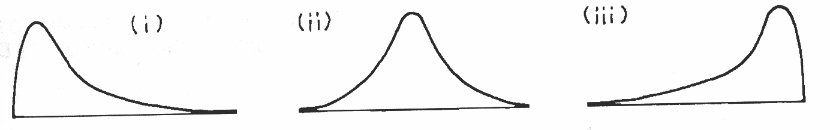
17. One term, about 700 Statistics 2 students at the University of California, Berkeley, were
asked how many college mathematics courses they had taken, other than Statistics 2.
The average number of courses was about 1.1; the SD was about 1.5. Would the
histogram for the data look like (i), (ii), or (iii)? Why?
18. Do not turn in your homework with the notebook frizz on the side. You should already know by now to tear that off before you turn in an assignment.
Reading:
"Ignoring your bias is hard to do", by Ed Willett, The Leader-Post (Regina, Saskatchewan), November 12, 2008 Wednesday, ARTS & LIFE; Pg. B1.
Document source: LexisNexis Academic. (Sign in via the Library Webpage under databases.)
Generally, search for the title (inside quotes) or author's name and the publication.
You can often use the default source type of "Major World Publications", but sometimes
need to add Magazines to that--you can just choose "All News" as well.
Another search method:
Enter the name of the article in the search field.
Click "Advanced Options."
Enter The Leader-Post for a Source, and you will see The Leader-Post (Regina) as an option to choose.
Click Apply, and then search.
Adding this to the Advanced Options sometimes helps you find the article faster.
Without it, your article might be on the 50th page.
Possible essay questions:
You should think about the questions. They might show up on a test, but you don't have to turn them in ith your homework.
- State and describe two types of biases that were discussed in the article.
- Describe the two experiments that were in the article. What were the findings of the experiments?
- What are some things that you can do to lessen the impact of your own biases when making decisions?